
This autumn we’re bringing two updates that change how you work with trial results: an AI assistant that turns your data into a report in seconds, and weather data for every trial.
AI Reporting: ask a question, get a report
Running trials is only half the job. The other half starts when the season ends: exporting data, cleaning spreadsheets, building charts, comparing varieties across locations. For many teams, that analysis takes days.
With the new SeedSoft AI Assistant, it takes a single prompt.
Your trial results are already in SeedSoft, and now the tool that analyses them is there too. No exports, no switching between files and tools. Describe what you need in plain language:
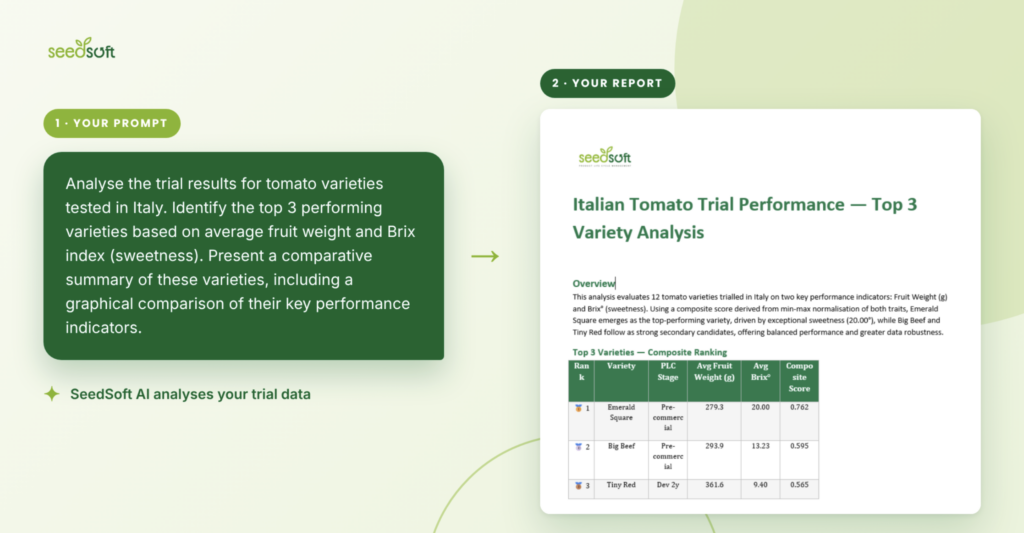
“Analyse the trial results for tomato varieties tested in Italy. Identify the top 3 performing varieties based on average fruit weight and Brix index (sweetness). Present a comparative summary of these varieties, including a graphical comparison of their key performance indicators.”
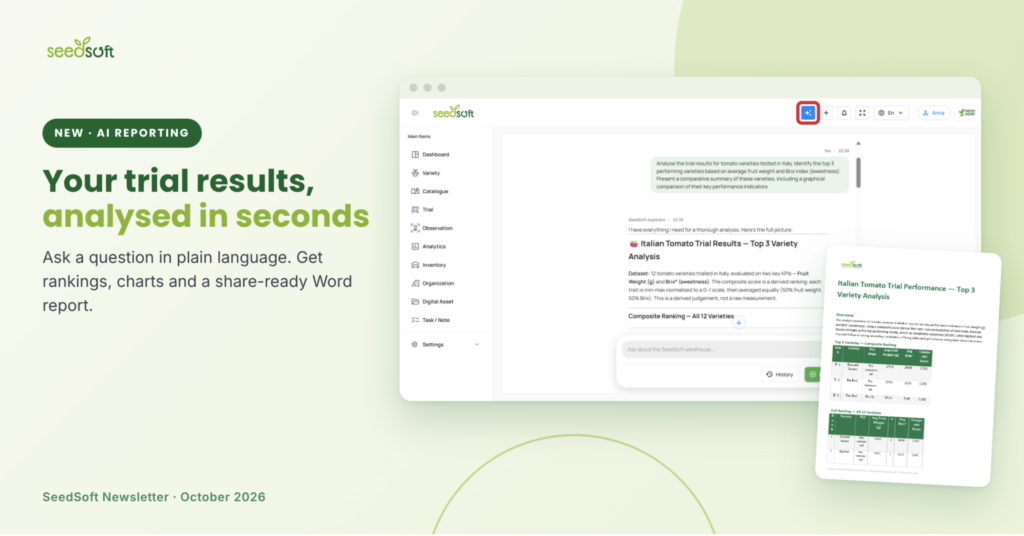
Ask about a single trial or compare results across many. Pick a crop, a trait, a region or a season. The more specific your prompt, the more targeted the report.
Within seconds, the Assistant walks you through the findings and builds a share-ready report.
Available on desktop and mobile
Out of the office and need results from specific trials, ideally with conclusions, right now? No problem: AI Reporting is available in the SeedSoft mobile app too.
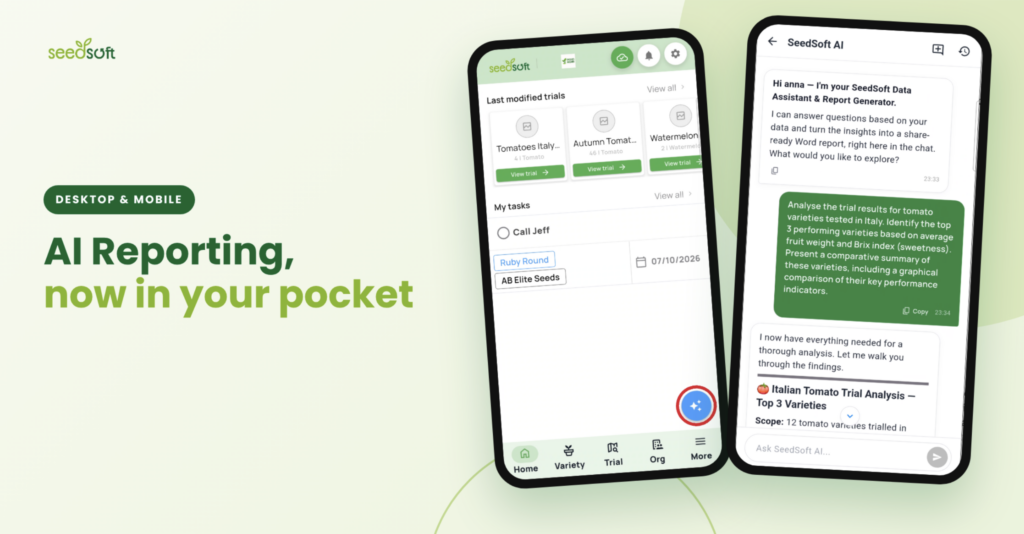
Your conversations are saved in History on both, so you can pick up any analysis later.
Weather Data for Every Trial
How did the season really go at your trial site? Now you can check without leaving SeedSoft.
Add an exact location and dates to your trial, and the new Weather tab will show the conditions at that site for the whole trial period.
At the top, a season summary gives you the key numbers at a glance: Growing Degree Days, total precipitation and evapotranspiration with the resulting water balance, the temperature range, and the number of heat-stress and frost days.
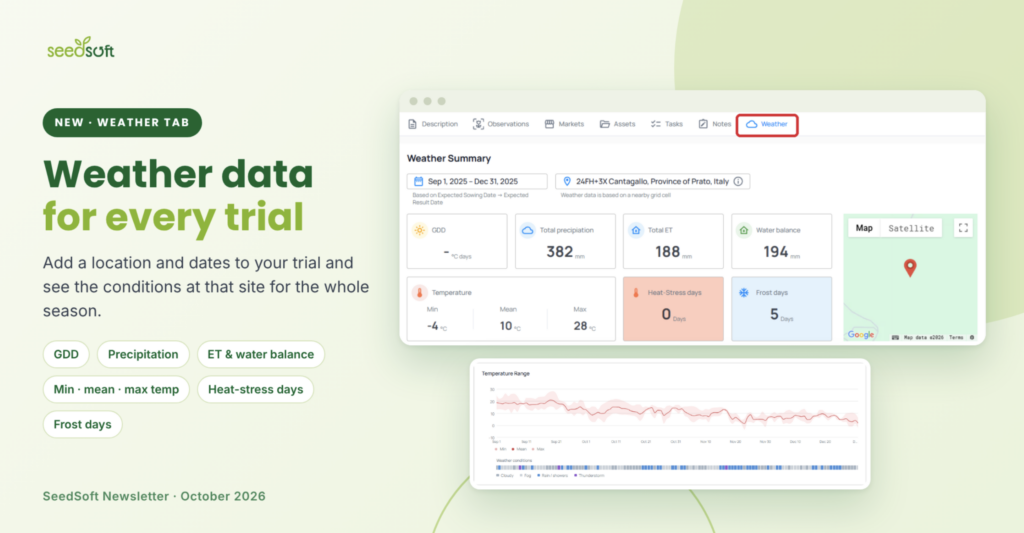
The Weather Summary: season totals, temperature extremes and the trial location on the map.
Below it, daily charts take you through the season day by day: temperature with the weather conditions on each day, wind speed, rainfall compared with reference evapotranspiration (ET₀), and soil moisture and temperature at different depths.
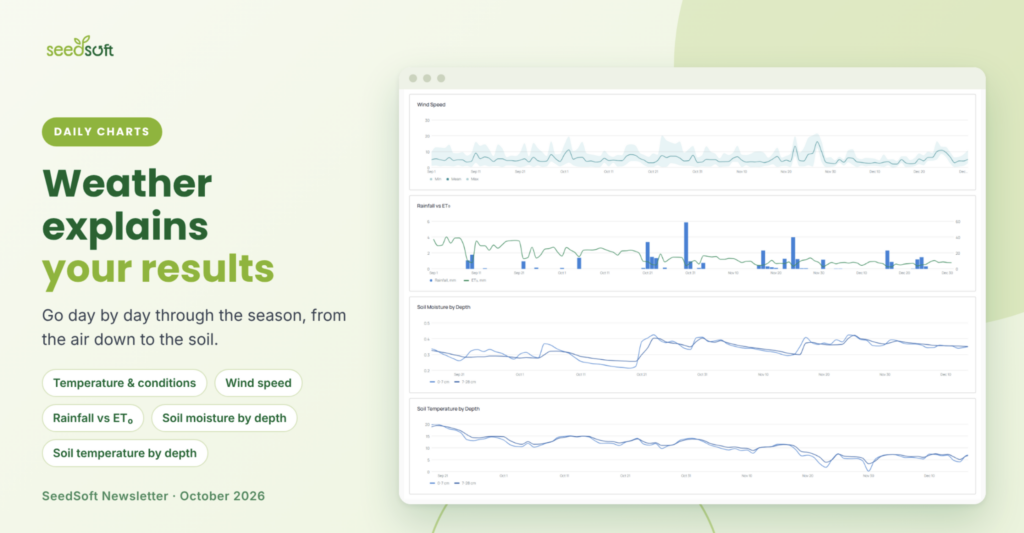
Daily charts for wind, rainfall vs. ET₀, soil moisture and soil temperature.
Why does it matter? Weather explains results. A variety that underperformed may have faced five frost days or a three-week dry spell. With weather data next to your observations, you can interpret trial outcomes with confidence and present them to your customers with the full story.
Want to learn more?
If you’d like a walkthrough of AI Reporting or the Weather tab, reach out to our support team. We’re happy to show you how both features fit into your workflow.
Questions or want a quick walkthrough? Contact us [email protected]